Dashboard
The Dashboard tab gives a simple project health view. At a glance it shows how complete your specs are, how Boards work is progressing, and where delivery risk is.
Numbers stay sparse or empty until you complete Your First Feature or already have Boards work items and Spec Kit artifacts. That is normal for a new project.
Use the Iteration (sprint) and team selectors at the top when you want sprint-scoped numbers. Sprint, review, and deploy metrics use the selected team’s area paths.
KPI cards
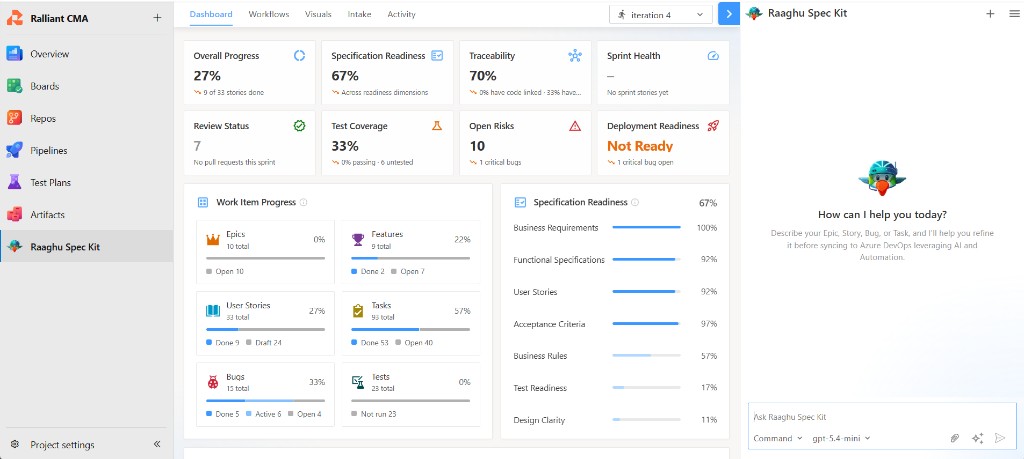
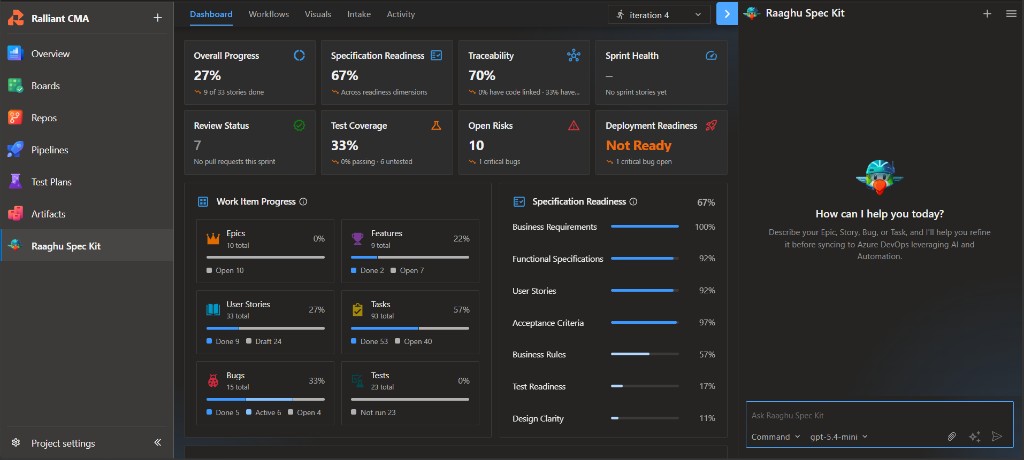
The top of the Dashboard shows eight cards. Each card has a main value and a short line under it. Click a card to open a drill-down list. Hover truncated labels or badges to see the full text.
A dash (--) means there is not enough data yet (for example no sprint stories, or no pull requests).
| Card | In plain terms |
|---|---|
| Overall Progress | How much project work is done. Based mainly on completed stories and tasks. The line under the % is often Across work items, or the selected sprint’s completion when a sprint is in progress. |
| Specification Readiness | How ready your Spec Kit specifications are for implementation. The % is an overall score; the line under it shows how many gaps still need attention (for example thin or missing sections). |
| Traceability | How well work items are linked in the hierarchy (parent/child and related delivery links). If coverage is incomplete, the line under the % shows how much is left to reach full coverage. |
| Sprint Health | Health of the selected sprint: Healthy, Watch, or At Risk — work done vs time elapsed, scope change, and blockers. Early in a sprint it does not jump to At Risk only because little work is done yet. Shows -- when there are no sprints / no stories for the selected team. |
| Review Status | Pull-request review health for the selected sprint/team: Healthy, Watch, or At Risk. The line under it summarizes awaiting review, changes requested, and merged. Drill-down lists pull requests (opens the PR, not a work item). |
| Test Coverage | Of closed user stories, how many have linked test cases. The line under the % shows how many closed stories still need tests. |
| Open Risks | Count of open risks that can hurt delivery — mainly open bugs and blocked sprint items. The line under the count notes whether any are critical. |
| Deployment Readiness | Release readiness for the selected sprint/team: Ready, Watch, or Not Ready, from gates such as latest build, automated tests, critical bugs, sprint work done, and approvals. Trend copy reflects whether release gates pass. |
Tip: Cards that mention a sprint (Sprint Health, Review Status, Deployment Readiness) follow the Iteration and team selectors at the top of the Dashboard.
Work Item Progress
Under the KPI cards (left side), Work Item Progress shows how each Boards work-item type is moving.
You typically see a small card for:
- Epics
- Features (sometimes labeled Issues, depending on your process template)
- User Stories
- Tasks
- Bugs
- Tests
For each type you get:
- A % done
- A total count
- A simple bar of states (for example Done / Active / Open, or Done / Active / Draft)
- Counts next to those states
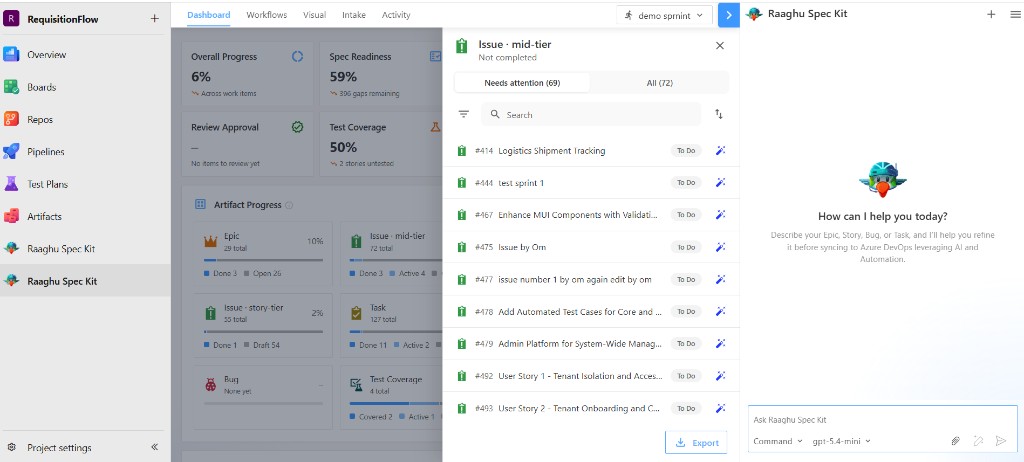
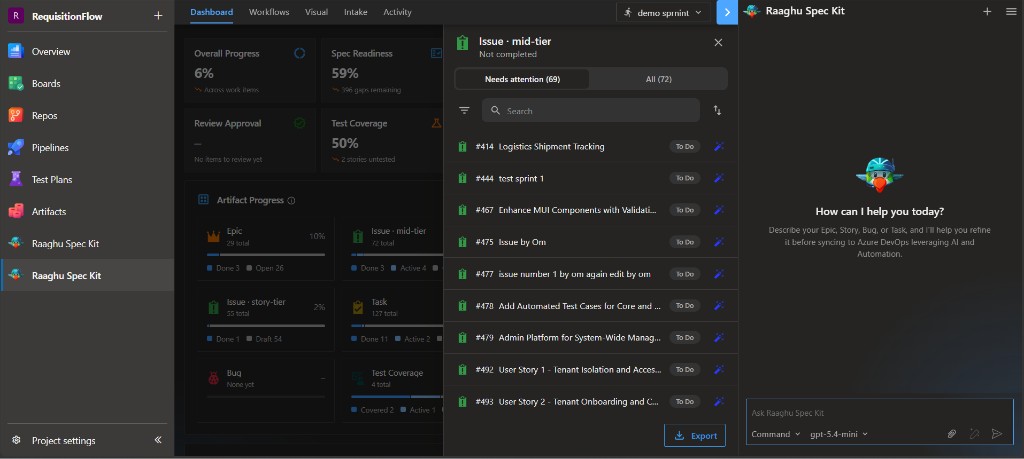
Click a type to open the list of items. In that list you can switch between Needs attention (items that still need work) and All.
If a type says None yet, that type has no items in the project yet.
Specification Readiness (panel)
Next to Work Item Progress, the Specification Readiness panel breaks the overall readiness score into seven areas. The big % in the panel header is the same overall idea as the KPI card.
| Area | In plain terms |
|---|---|
| Business Requirements | Are business needs clearly written and complete? |
| Functional Specifications | Is the system behavior clearly defined? |
| User Stories | Are user needs and outcomes clearly described? |
| Acceptance Criteria | Are “done” conditions clear enough to accept the work? |
| Business Rules | Are business rules and logic documented? |
| Test Readiness | Can the spec be checked with clear tests and expected results? |
| Design Clarity | Is the expected experience / design clear enough? |
Each row shows a %. Hover the info icon for a short tip. Click a row to see the related gaps.
Lifecycle Progress
Below those two panels, Lifecycle Progress shows work flowing through the delivery path:
Requirements → Specifications → Stories → Tasks → Tests → Release
Each stage has:
- A progress ring (%)
- A short status (for example Complete, In progress, Pending, Ready, Watch, At Risk)
This helps you spot where work is stuck. The weakest stage may be highlighted as a bottleneck. Click a stage to open related details.
Drill-down and export
From any drill-down drawer you can search, filter, and sort rows, open the related item in Azure DevOps (work item or pull request), refine supported work items with AI (magic wand), or Export the list as CSV.
Overall Progress CSV export uses columns Type, Total, and Completion (aggregate breakdown).
Work Item Progress and Test Coverage drill-downs also offer Needs attention and All tabs.